I wanted to build a specific post relating to how the analysis of the s&p 500 is going to develop, because I’ve left it in a stationary position for a little while now and it has provided me with greater insight into my current trades. I can only imagine that if I am able to develop this further, that I may be able to provide a much greater insight for others.
To achieve this I need to basically throw what I’ve done into the trash and start again, where my development can become scalable. My plan is to take a more methodical approach by building version two in a modular way. This means I can hopefully perform much more advanced analytics over time, without losing any history of what has been done before.
I may then expand the graphical components out using a software solution like grafana as the analysis grows, it’s possible I will section it off from my blog.
Challenge 1: Accurate Identification of S&P 500 tickers.
My first challenge is accurately pull the S&P 500 tickers on a regular basis, so that I can ensure that my ticker list is correct. This is because the S&P 500 does change over time, so I need to keep up to date with it, as those changes occur.
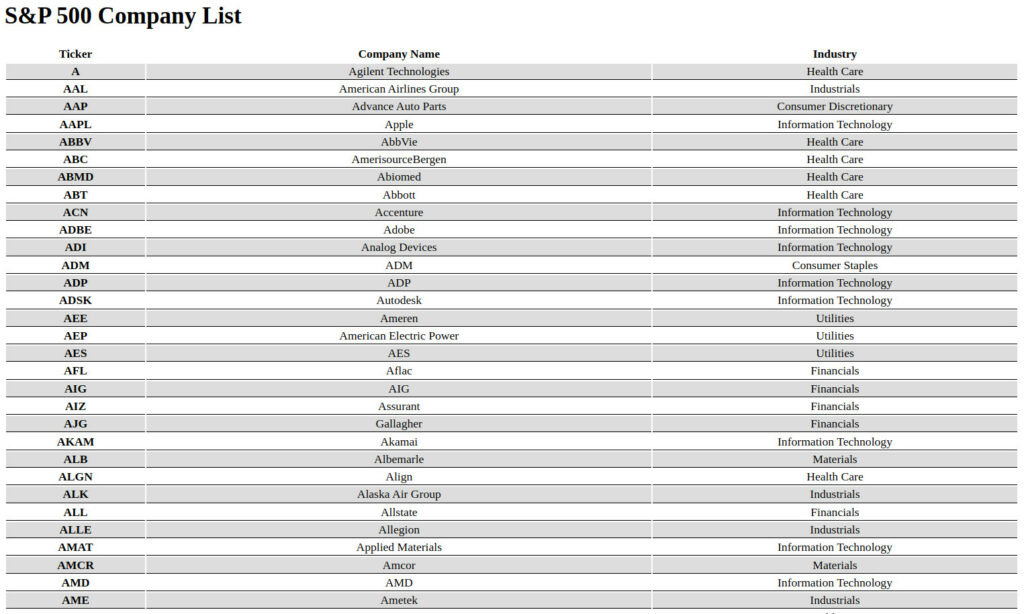
The resolution to this is to utilise an existing python script that is hosted on Github (link), which scrapes the list of tickers from the Wikipedia page. This was not developed by me, so full credit to the guys who put this on Github. I plan on running this python script once a week via a cronjob, followed by some formatting locally and then uploading to a database. This will create the foundations of my stock analysis, allowing for me to know what tickers to query and to provide some basic information about the tickers (ticker, company name & industry).
See the completed result in the screenshot below. A weekly list of the S&P 500 companies, being presented as a basic webpage.

Date of Challenge 1 completion: 2022.03.20
